Architecture
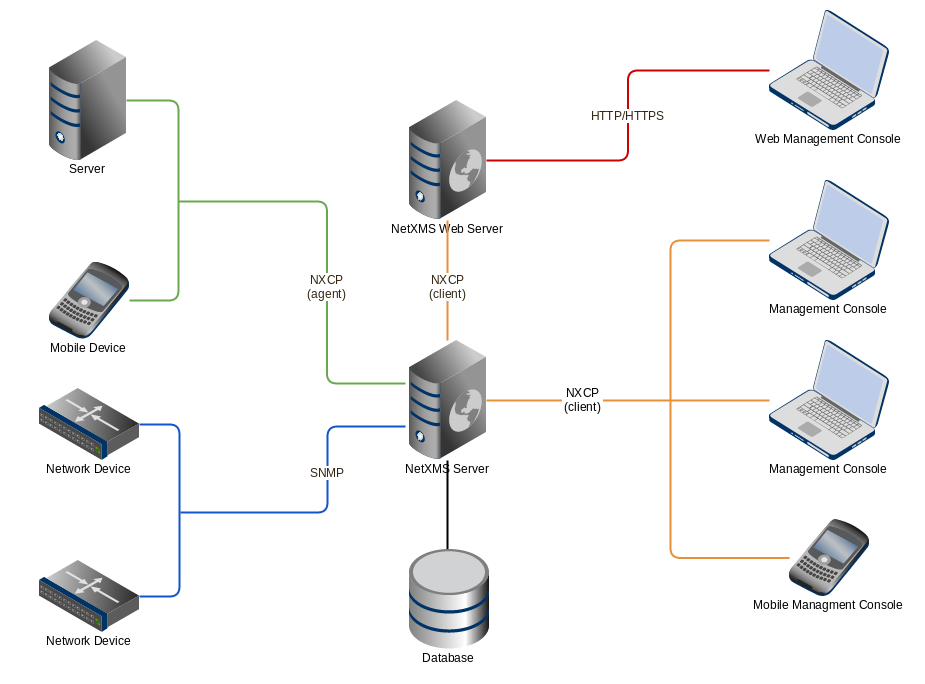
NetXMS uses a three-tier architecture: monitoring agents collect data from managed systems and deliver it to the central server for processing and storage. Administrators access the system through cross-platform management clients.
Object Model
All monitored infrastructure is represented as a hierarchical set of objects. Each object represents a physical or logical entity (host, network interface, subnet) or a group of entities (container, cluster).
Objects are organized in a tree structure. An object can have multiple parents — for example, a node can belong to multiple containers, subnets, and templates. The structure can be modified manually or automatically using auto-bind scripts.
Each object has its own access rights, applied hierarchically to all children. For example, granting Read access on a container gives read access to all objects within it.
NetXMS has seven top-level root objects:
-
Entire Network — root of the IP topology tree, contains zones and subnets
-
Infrastructure Services (internal name: Service Root) — root for organizing monitored infrastructure
-
Template Root — root for data collection and policy templates
-
Asset Root — root for hardware asset management
-
Network Map Root — root for network map objects
-
Dashboard Root — root for dashboard objects
-
Business Service Root — root for business service availability tracking
Common Object Classes
| Object Class | Description | Valid Children |
|---|---|---|
Zone |
Group of interconnected IP networks without overlapping addresses. |
Subnet |
Subnet |
IP subnet, typically created automatically by the system based on interface configuration. |
Node |
Container |
Grouping object for building logical service hierarchies. |
Container, Node, Cluster, Rack, Chassis, Collector, Sensor, and others |
Node |
Physical host or network device. Created manually or via network discovery. Contains interface objects created during configuration polls. |
Interface, Network Service, VPN Connector |
Interface |
Network interface of a managed device. Usually created automatically during configuration polls; can also be created manually. |
— |
Cluster |
Logical grouping that aggregates data from multiple nodes. |
Node |
Template |
Data collection and agent policy template applied to nodes and other objects. |
Node, Cluster, Collector, Sensor, Mobile Device, Access Point, Chassis, Circuit, and other data collection targets |
Collector |
Container with data collection capabilities. |
Same as Container |
Rack |
Visual representation of physical rack equipment. |
Node, Chassis |
Sensor |
Logical object for data collected via external means (e.g. MQTT). |
— |
Business Service |
Represents a business service for SLA/availability tracking. |
Business Service, Business Service Prototype |
Object Status
Each object has a status calculated from polling results, child object statuses, active alarms, and status DCIs.
| Nr | Status | Description |
|---|---|---|
0 |
Normal |
Object is in normal state. |
1 |
Warning |
Warning(s) exist for the object. |
2 |
Minor |
Minor problem(s) exist for the object. |
3 |
Major |
Major problem(s) exist for the object. |
4 |
Critical |
Critical problem(s) exist for the object. |
5 |
Unknown |
Object status is unknown to the server. |
6 |
Unmanaged |
Object is set to unmanaged state. |
7 |
Disabled |
Object is administratively disabled (interfaces only). |
8 |
Testing |
Object is in testing state (interfaces only). |
Unmanaged status: An unmanaged object is not polled and no data is collected. Use this for objects that are temporarily or permanently unavailable.
Maintenance mode: While in maintenance mode, the object is still polled and DCI data is collected; events are still generated, but they are correlated to the maintenance event and by default do not create alarms or trigger actions. Use this during planned maintenance windows to suppress alerts.
Event Processing
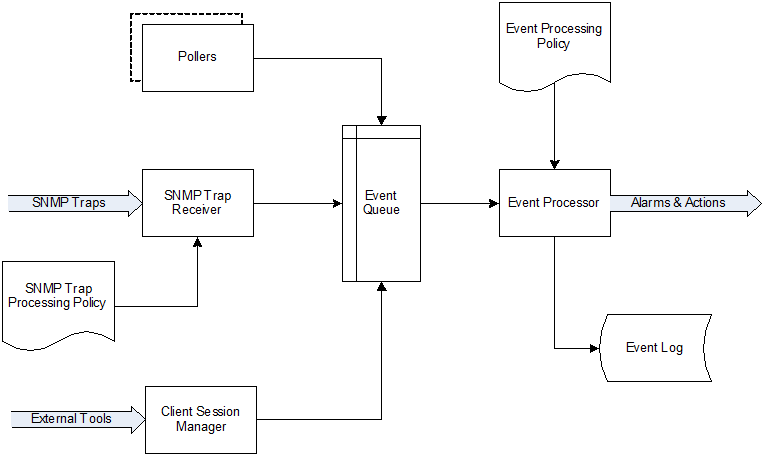
NetXMS is an event-based monitoring system. Events originate from polling processes (status, configuration, discovery, data collection), SNMP traps, syslog messages, and external applications.
All events flow into the Event Queue and are processed by the Event Processor according to rules defined in the Event Processing Policy (EPP). Processing can generate alarms, execute actions (notifications, scripts, commands), or both.
For details on configuring event processing, see Event Processing & Alarms.
Polling
NetXMS server gathers status and configuration data from objects through periodic polling.
| Type | Purpose |
|---|---|
Status |
Determine current object status |
Configuration |
Detect interfaces, capabilities, and protocols |
Topology |
Discover Layer 2 network topology |
Routing |
Gather IP routing information |
ICMP |
Ping nodes, collect response time statistics |
Instance Discovery |
Create/remove DCIs based on discovered instances |
Automatic Binding |
Bind/unbind containers, templates, and dashboards |
Network Discovery |
Find new nodes from neighbor address tables |
Each poll type runs on its own configurable interval, which can also be overridden per object — see Polling Intervals for the variables and defaults. Several poll types execute an NXSL hook script on completion; see Hook Scripts.
Data Collection
NetXMS collects metrics from each node as Data Collection Items (DCIs).
Metrics can be single-value (e.g. System.CPU.Usage), list (e.g. FileSystem.MountPoints), or table (e.g. FileSystem.Volumes).
Collected values are checked against configured thresholds.
Supported data sources:
| Source | Description |
|---|---|
Internal |
Server-generated statistics |
NetXMS Agent |
Collected from installed agent on schedule |
SNMP |
Via SNMP protocol on schedule |
Web Service |
From JSON, XML, or plain text via HTTP |
Push |
Values pushed by external systems or NXSL scripts |
Windows Performance Counters |
Via NetXMS agent on Windows |
SM-CLP |
Via SM-CLP protocol from server management controllers |
Script |
Generated by NXSL script from the Script Library |
SSH |
Output of commands executed over SSH |
MQTT |
Subscribed MQTT broker topics |
Network Device Driver |
Via specialized SNMP device drivers |
Modbus |
Via Modbus-TCP industrial protocol |
EtherNet/IP |
Via EtherNet/IP industrial protocol |
Cloud Connector |
Metrics for cloud resources retrieved through cloud connectors |
OTLP |
Values received via OpenTelemetry protocol (OTLP) |
Traffic Observer |
Network traffic statistics from traffic observation points |
NETCONF |
Retrieved from network devices via NETCONF queries |
Network Discovery
NetXMS can automatically detect devices on your network:
Passive discovery: Queries ARP and routing tables from known nodes. Non-intrusive — no scanning of the network.
Active discovery: In addition to passive methods, scans configured address ranges using ICMP, SNMP, and optionally TCP probes.
SNMP trap and syslog messages can also serve as discovery sources.
Security
All communications in NetXMS are encrypted and authenticated:
-
Agent connections are encrypted with AES-256 by default; other ciphers (AES-128, Blowfish, IDEA, 3DES) remain available for compatibility
-
Agents authenticate connections via IP allowlists and optional pre-shared keys
-
User passwords are hashed with Argon2id
-
Stored secrets and passwords can be obfuscated or loaded from external vault